To ensure that workloads are managed appropriately in the field, coaches often rely on setting thresholds to indicate when a player may be at risk of injury. Typically, these thresholds are informed by coaches knowledge, experience, scientific research or a combination of all three. However, to date it has been difficult for coaches to test their assumptions around workload thresholds. For example, testing whether set thresholds are indeed optimal for players requires linking historical workload data and previous injury information. Often, time and resource constraints limit the extent to which those investigations can take place in practical professional sports settings.
Our aim at Kitman Labs is to help coaches to make informed decisions about their workload monitoring and management based on quantified injury risk. To do so, we have designed tools that allow coaches to flexibly set thresholds. We also understand the value of enabling coaches to understand the relationship between their thresholds and injury rate based on their previous data. To illustrate our point, we present below some examples from our anonymised dataset. We hope that these examples show how coaches and sports scientists can make workload threshold decisions based on evidence from their own teams data. From there, we discuss how this process can practically be used to reduce injury risk and optimise performance.
Practical Examples
The data presented uses A:C ratio and injury rate from four different rugby teams across all training sessions (over a one year period). Acute workload is calculated here as the sum of the workload from days 1-7 prior to exposure to injury. Chronic is calculated as the sum of the workload from days 1-28 prior to exposure to injury. The A:C ratio here is calculated by dividing the mean acute workload over 7 days by the mean chronic workload over 28 days. Any type of injury that occurred over this time period was considered, regardless of severity, mechanism, body area or pathology.
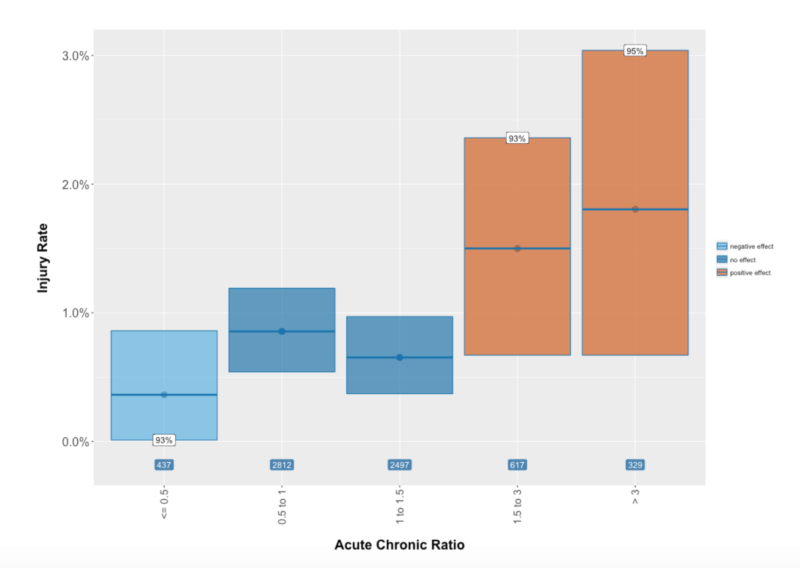
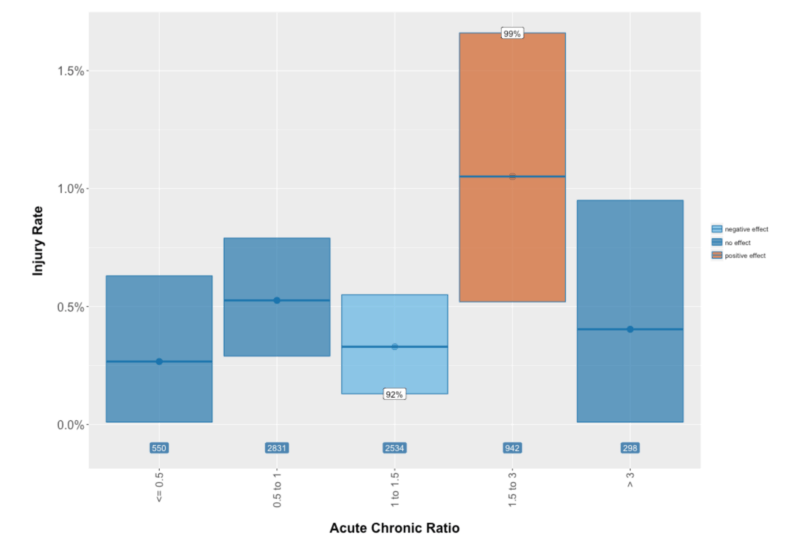
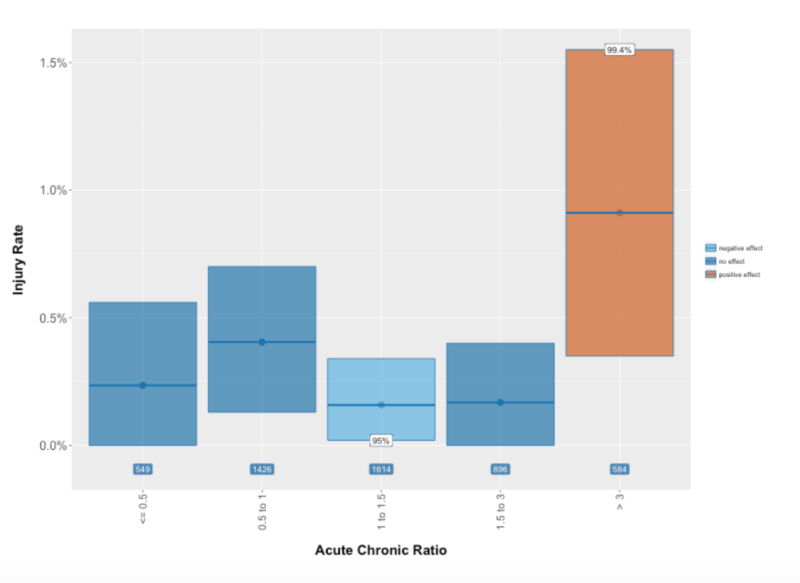
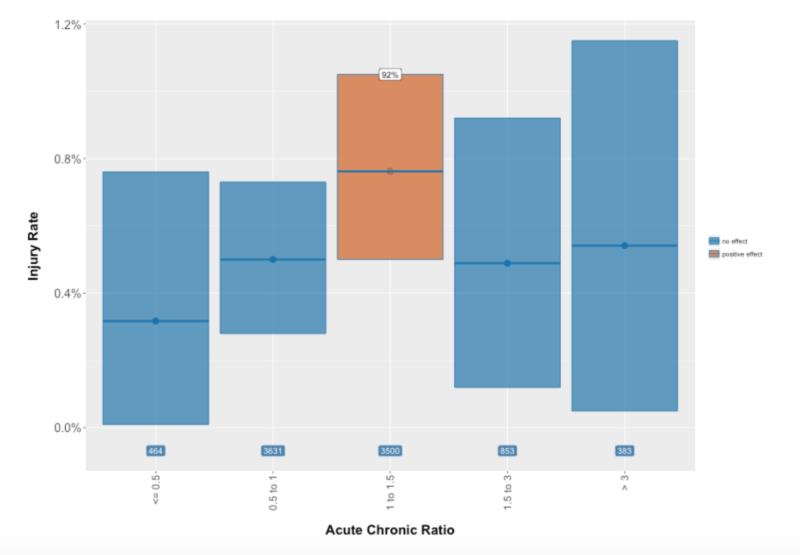
In the plots below the data is broken into bins. Each bin represents a range of A:C ratio. Bayesian statistical methods are employed to examine whether a bin has a notably different injury rate compared to all other bins. A range of A:C workload ratio is considered notable if there is at least a 90% chance that the rate of injury in the bin is at least 10% higher or lower than all the other bins combined. The size of the bin indicates confidence levels and the colour indicates a notable difference in injury rate compared to all the other bins. Orange indicates where the injury rate was at least 10% higher and light blue indicates where injury rate was 10% lower.
Team 1

From the plot, we can see that the expected injury rate when players A:C ratio is between 1.5 and 3 is notably higher. In this case, players with A:C ratio between 1.5 and 3 are almost twice as likely to get injured during a training session compared to players with any other value of A:C ratio. This information could inform coaches on what thresholds to set for A:C ratio.
For example:
- If a player’s A:C ratio exceeds 1.5 and their wellbeing and musculoskeletal parameters remain within normal ranges for that player, modification may not be necessary.
- In contrast, if a player’s A:C ratio exceeds 1.5 and their wellbeing and musculoskeletal parameters do not remain within normal ranges for that player (i.e. increased fatigue, stress or decrements in musculoskeletal function) modification may be necessary to reduce risk of injury for that player.
- Similarly, planning workload to ensure that A:C ratio does not exceed 3 could be utilised to reduce the likelihood of players getting injured.
Team 2

If Team 2 previously set their A:C threshold at 1.5 they might be unnecessarily limiting players training opportunities. From the plot below, we can see that when players experience a A:C ratio between 1 and 1.5 they are less likely to get injured. Furthermore, in contrast to Team 1, when A:C ratio is between 1.5 and 3, injury rate is not higher. However, when A:C ratio is greater than or equal to 3, players are nearly 4 times as likely to get injured compared to players with a A:C ratio less than 3. If team 2 applied a threshold of 1.5, players would be inappropriately missing training opportunities when injury risk is not increased (1.5-3).
Team 3

In contrast to Team 2, if Team 3 set their A:C threshold at 3, coaches may be unaware of players who are at risk. From the plot below we see that injury rate is increased when A:C ratio ranges between 1.5 and 3, but in this case there is no notable increase in injury rate when A:C ratio exceeds 3.
Team 4

If Team 4 set their A:C ratio threshold to 1.5, coaches would not be alerted when players are at increased risk of injury. The plot below shows no notable injury rate when A:C ratio is above 1.5. There is, however, a notable injury rate when A:C ratio is between 1 and 1.5.
Conclusion
To ensure that workloads are managed appropriately in the field, coaches often rely on setting thresholds to indicate when a player may be at risk of injury. To ensure that thresholds are being set appropriately, understanding the complexity of the relationship between levels of workload and injury rate within a team is important. For example, in Team 1’s case presented above, we see that players with low A:C ratio are less likely to get injured when A:C ratio does not exceed 0.5, however, the level of workload required to make training and performance gains must be taken into consideration here as well as injury risk. If a player’s load is consistently low, they are unlikely to make performance gains. Also, without sufficiently high training load exposure, players are more likely to get injured during competition when demands exceed those experienced during training. Therefore, alerting a coach to when a player is not being exposed to sufficient training load could be useful to inform training progression.
References
- Buchheit M. Applying the acute:chronic workload ratio in elite football: worth the effort? BJSM 2016, In press.
- Gabbett TJ. The training-injury prevention paradox: should athletes be training smarter and harder? Br J Sports Med 2016;50(5):273-80 doi: 10.1136/bjsports-2015-095788
- Blanch P, Gabbett TJ. Has the athlete trained enough to return to play safely? The acute:chronic workload ratio permits clinicians to quantify a player’s risk of subsequent injury. Br J Sports Med 2016;50(8):471-5 doi: 10.1136/bjsports-2015-095445
- Malone S, Roe M, Doran DA, Gabbett TJ, Collins K. High chronic training loads and exposure to bouts of maximal velocity running reduce injury risk in elite Gaelic football. J Sci Med Sport 2016 doi: 10.1016/j.jsams.2016.08.005


