Kitman Labs’ injury risk analytics links athlete data to medical and injury records allowing you to make decisions backed by your team’s unique, objective data. Kitman Labs links every metric back to risk of underperformance and risk of injury.
We have been improving our analytical methods every week and month and have recently started to dig up some real gold around individual athletes which allows us to start to understand how we can manage different people and just how different the approaches could and should be. Check out this insightful data pulled from a recent analysis of our NFL teams.
Here are three examples of our analytical approach to interrogating data for performance and injury risks. The findings also highlight that the analysis of practice sessions and games are equally important.
PERFORMANCE IN PRACTICE

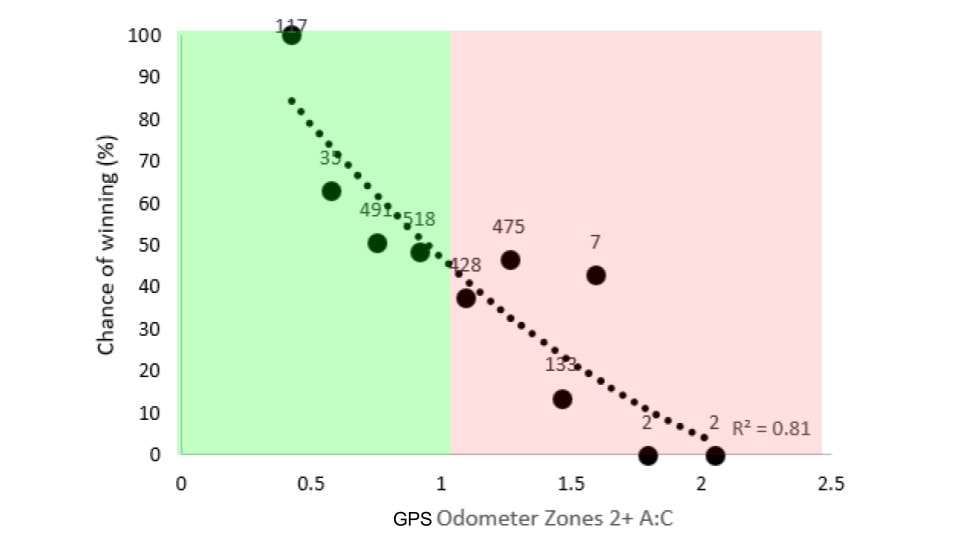
Chance of winning is increased when the A:C (7:28) of individual practice distance is less than 1.1 (R2=0.81)
Understand your players thresholds for different practice metrics so they are in peak condition for the demands of the game. Optimise practice to ensure a winning performance.

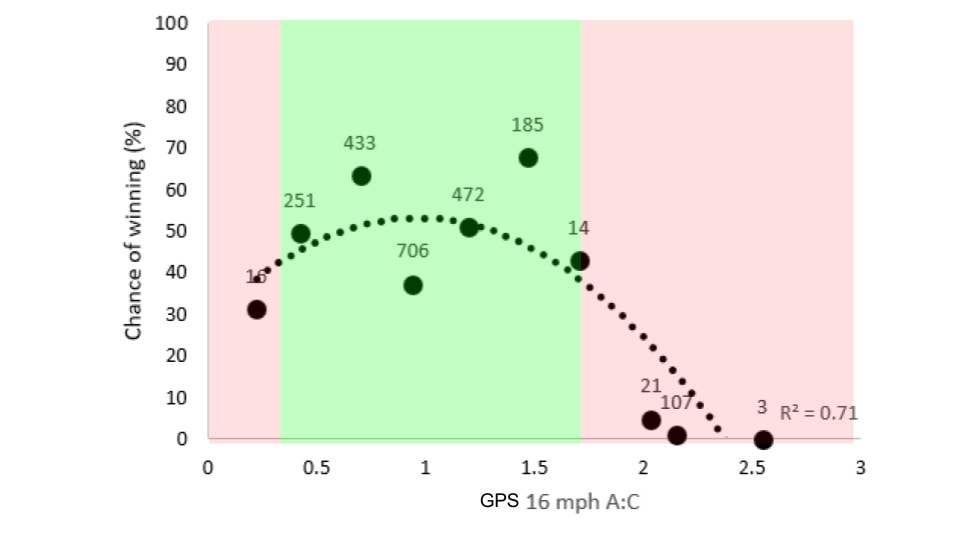
Chance of winning is increased when the A:C (7:28) of individual practice distance over 16 mph is between 0.3 and 1.7 (R2=0.71)
There is a sweet spot. The balance of doing too little v doing too much in practice, to optimise player performance on game day is a delicate one. The ability to quickly and easily collect, analyse and act upon data, specific to an individual athlete, can help negate a loss.
IN GAME

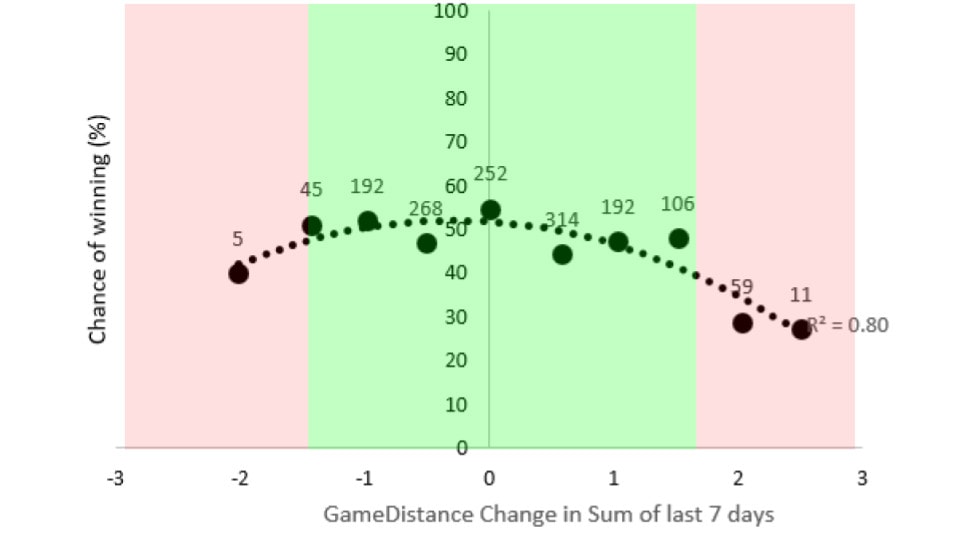
Chance of winning is increased when the sum of individual game distance in the last 7 days is between -1.5 and 1.6 standard deviations from individual mean (R2=0.8).
Game data (in this instance in the past 7 days) is a very important figure to be included when analysing and setting threshold for players optimum workload. And the influence of previous games on the outcome of success is highlighted in the graph above. If the player is not exposed to enough game distance the chance of winning is decreased as well as if they have been exposed to too much. As with practice data, there is a sweet spot.
INJURY

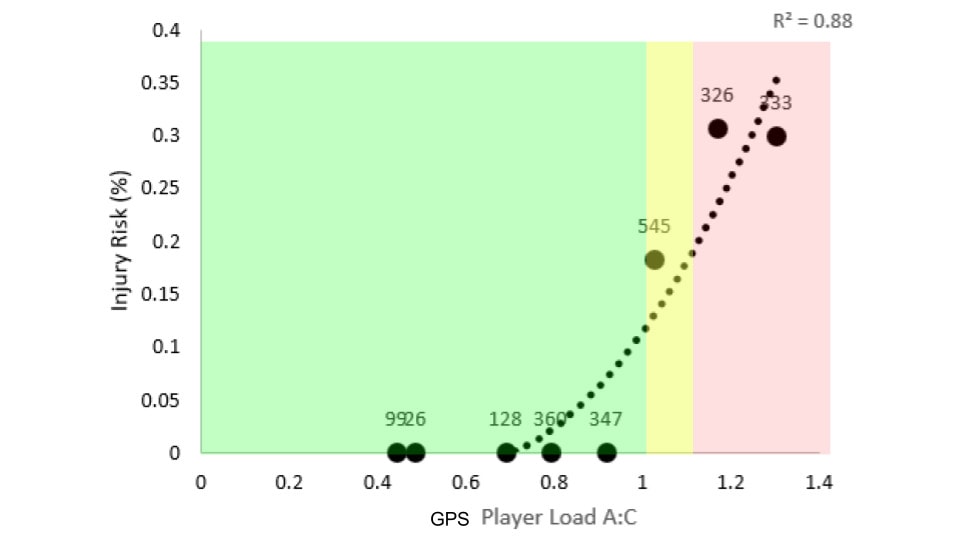
Injury risk is decreased when the A:C (7:28) of individual practice Player Load is less than 1.1. (R2=0.88).
Optimising performance whilst keeping players healthy is what coaches strive for daily. The quick analysis of meaningful data can help inform and support decision making when it comes training practices. The analysis of once such metric, A:C practice player load, as seen above can provide coaches with threshold markers to optimise individual player practice.
CONCLUSION
As our analytical methods continue to grow, we continue to discover insights that help us understand risks for injury or underperformance. With the aggregation and analysis of data linked back to injuries we allow the understanding of individualised injury risk and provide an individualised approach to ensure that all athletes have a bespoke method of analytics to suit their needs. Risk thresholds can then be set for individual athletes to support injury prevention strategies and these threshold adjusted over time to improve team efficiency.


