Injuries happen. We may put a lot of effort into different strategies trying to mitigate them, but unfortunately they still happen. And as injuries accumulate throughout the season, every practitioner—from technical staff and performance coach to doctor, physios or sport scientist—generally keep asking the following questions:
- Are we gettinag injured at a higher rate than “normal?”
- Are these injuries just part of the normal ‘survival’ process of elite sports?
- Are we comfortable with the frequency and number of injuries?
Every time an injury happens in my career, after each initial, painful and devastating incident, I always seek to understand what went wrong, by looking at every possible factor. The next step is to understand whether the actual rate of our injuries are “normal”, or above what should be expected. This is the first step in assessing our practices and taking measures to act accordingly.
The problem is that answering these questions is actually harder that it seems. There remain two challenges for practitioners willing to understand ‘normal’ injury rates:
- First, comprehensive benchmarks for large populations have always been scarce, and generally rely on what other practitioners have registered themselves – so there will always be doubt in the accuracy of the numbers. Hopefully, with time and the accumulation of data – either longitudinal (Ekstrand et al., 2021) or cross-sectionally (López-Valenciano et al., 2019), those numbers have gained robustness to be sufficiently informative for practitioners.
- Second, because training and match exposure likely influence injury rate, all reported ‘benchmarks’ are generally expressed relative to 1000 hours of exposure. While this makes sense to compare players and teams over different training and competitive contexts, it’s likely impossible for anybody to figure out what those rates convert to practically, i.e., “how many injuries should we expect this week or month?”
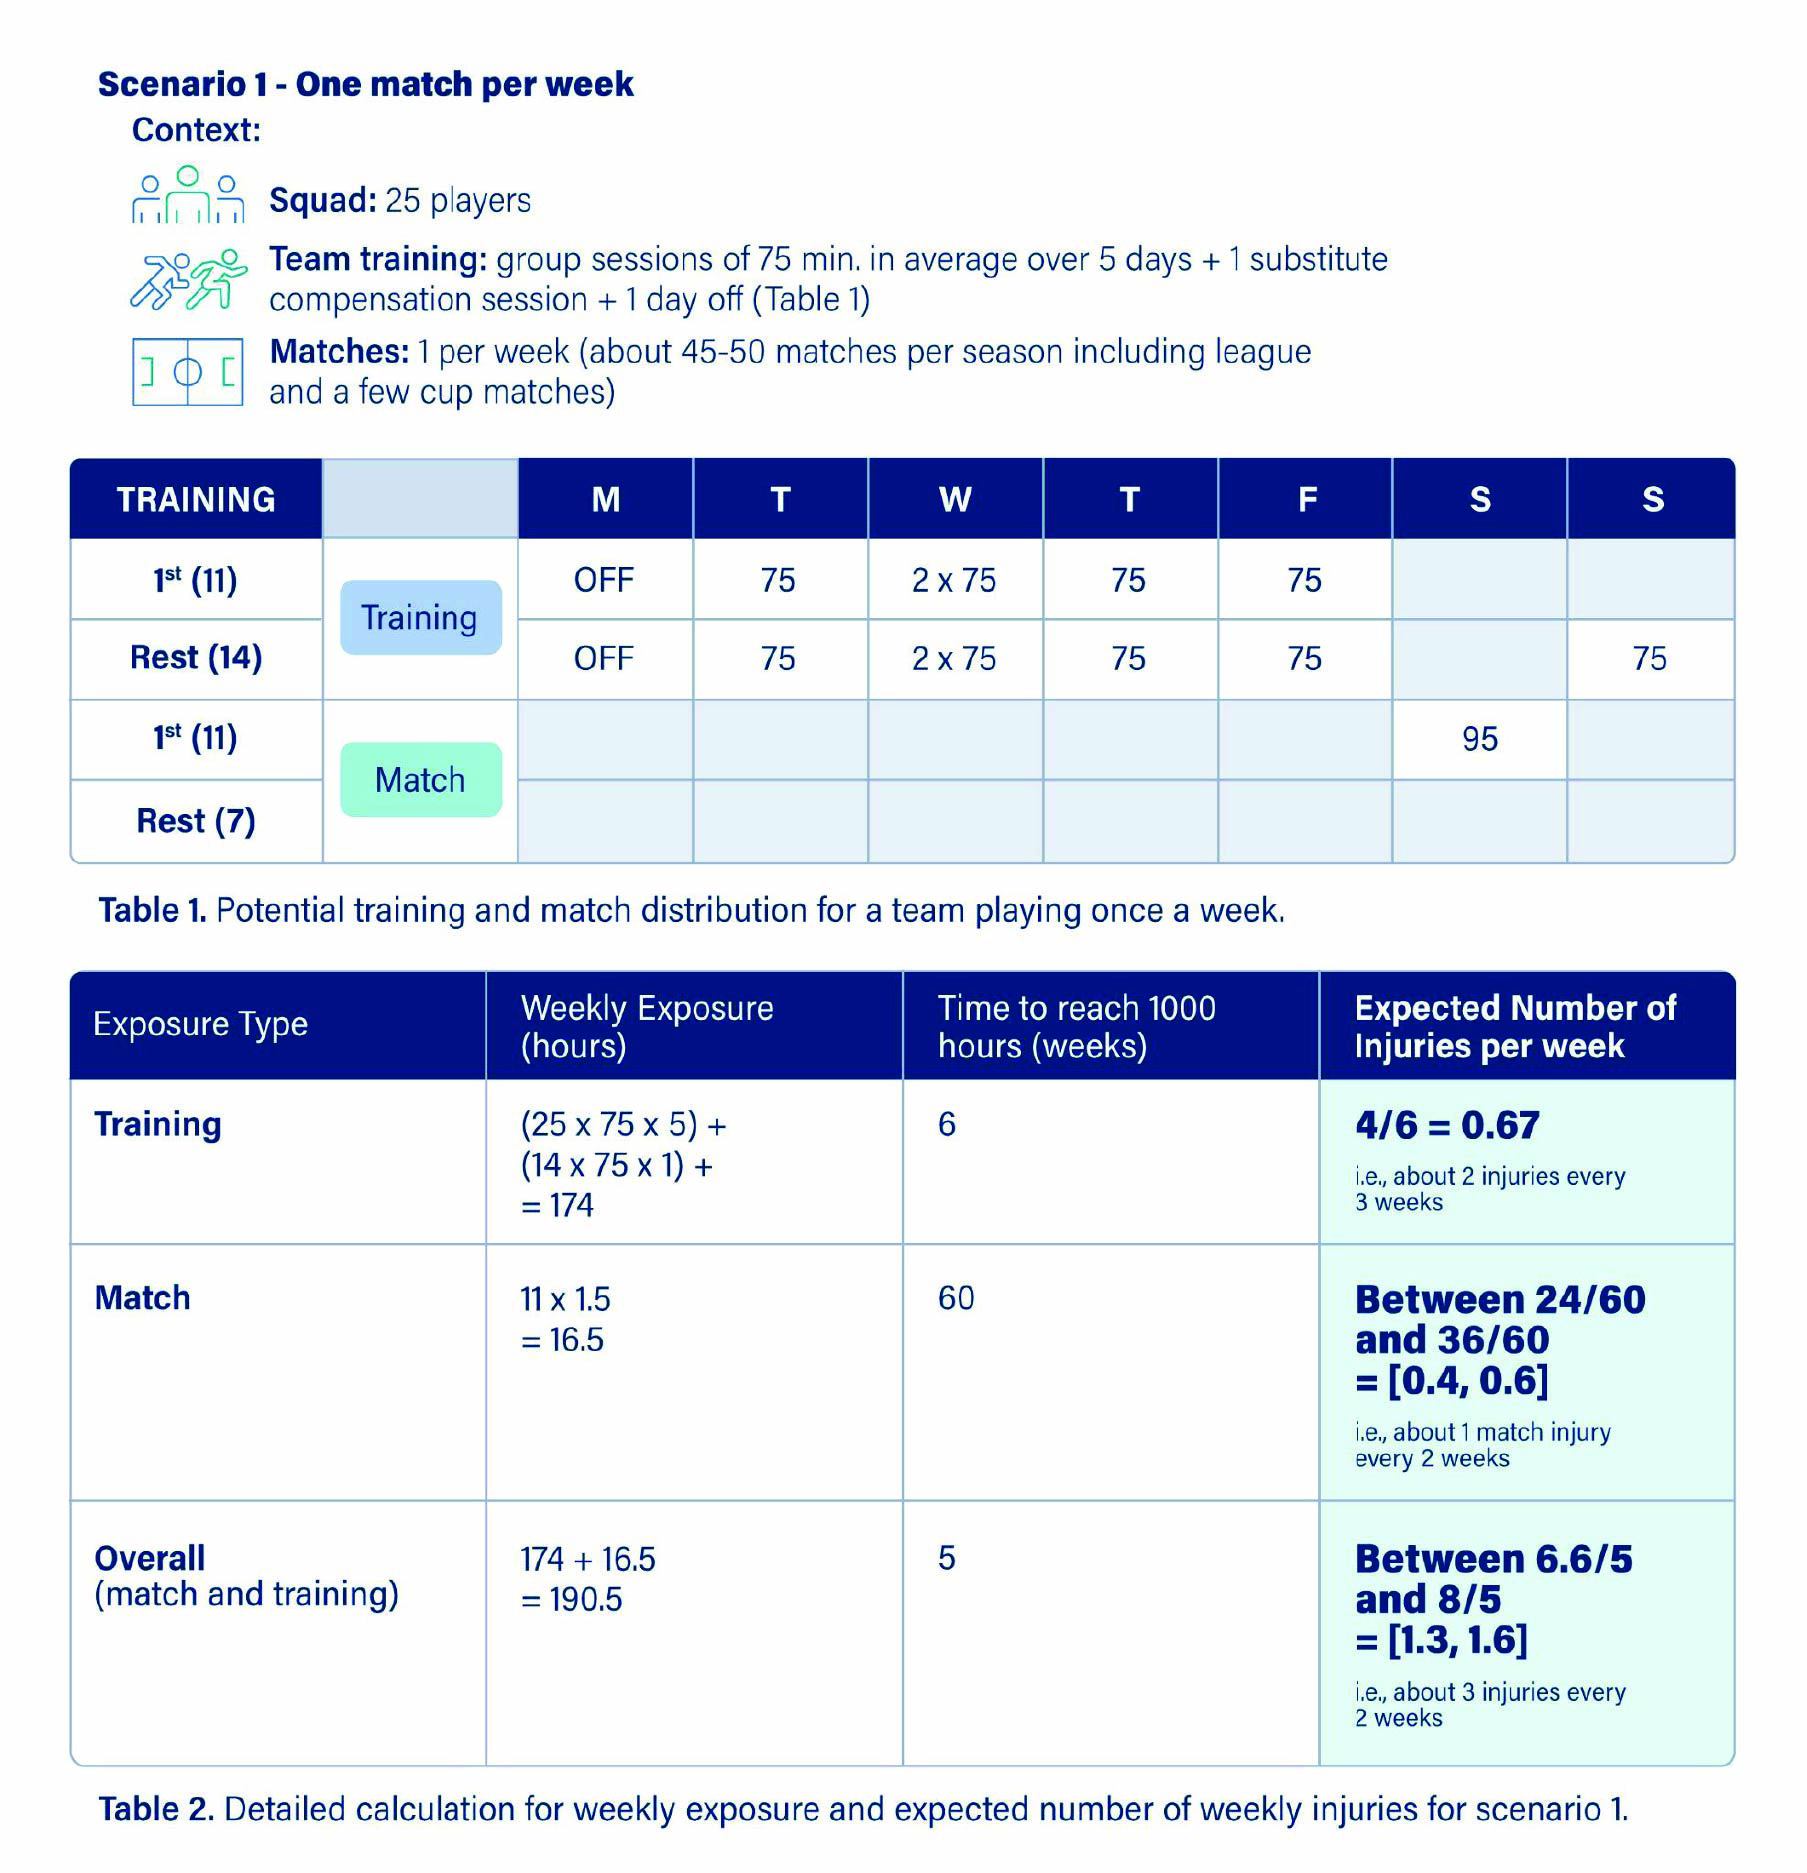
In the paper, we illustrate several scenarios. In the first scenario (one match per week), the expected number of injuries per week is shown in Table 2.
In this short paper, we aim to explain the injury rates reported in large scale studies (Ekstrand et al., 2021, López-Valenciano et al., 2019) in simple terms, so that a team may find them more useful in assessing their own injury context. This is not meant to be a rigorous analysis; it’s more to build intuition and understanding in practical terms when these numbers are quoted. To do this, we consider different scenarios representing training practices at the elite level of football (Buchheit et al. 2021). We express the injury rate per actual week of (training and match) exposure rather than the typical 1000 hours of exposure.
You can read the full paper Elite football injury risk explained: translating 1000-hour injury rates into expected weekly injury counts here.


