With injuries reportedly spiking across Premier League teams and 23% worse than last year, and Liverpool’s Jürgen Klopp again drawing headlines over fixture congestion, Kitman Labs Performance Intelligence Research Team analyzed publicly available game and injury data for all Premier League teams over the last three seasons to uncover new details about the levels and amount of congestion faced by Premier League teams. Our goal – find new insights that could support strategies to protect players and performance before the crushing injuries of the holidays kick in. Based on our analysis, which surfaced a key problem – players are racking up minutes in multiple congested games in a row, a concept we are calling congestion chains™ – we believe teams can mitigate injuries if they leverage data now to control the controllables.
Are players playing more?
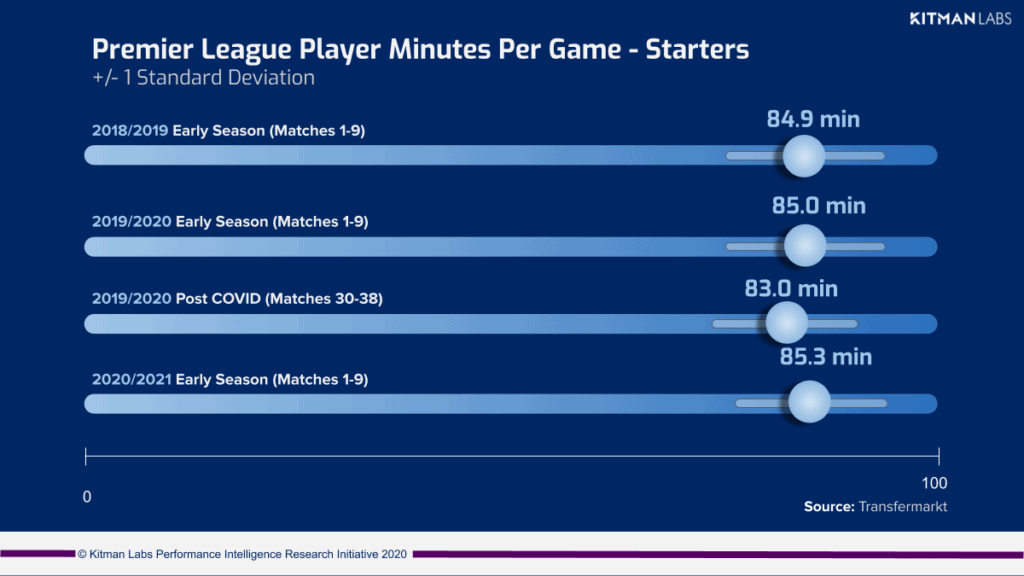
We began by looking at average minutes played per player for the first nine games across all competitions from 2018-2020. The minutes played were essentially the same: 84.9 minutes in 2018, 85 in 2019 season, and 85.3 in 2020.
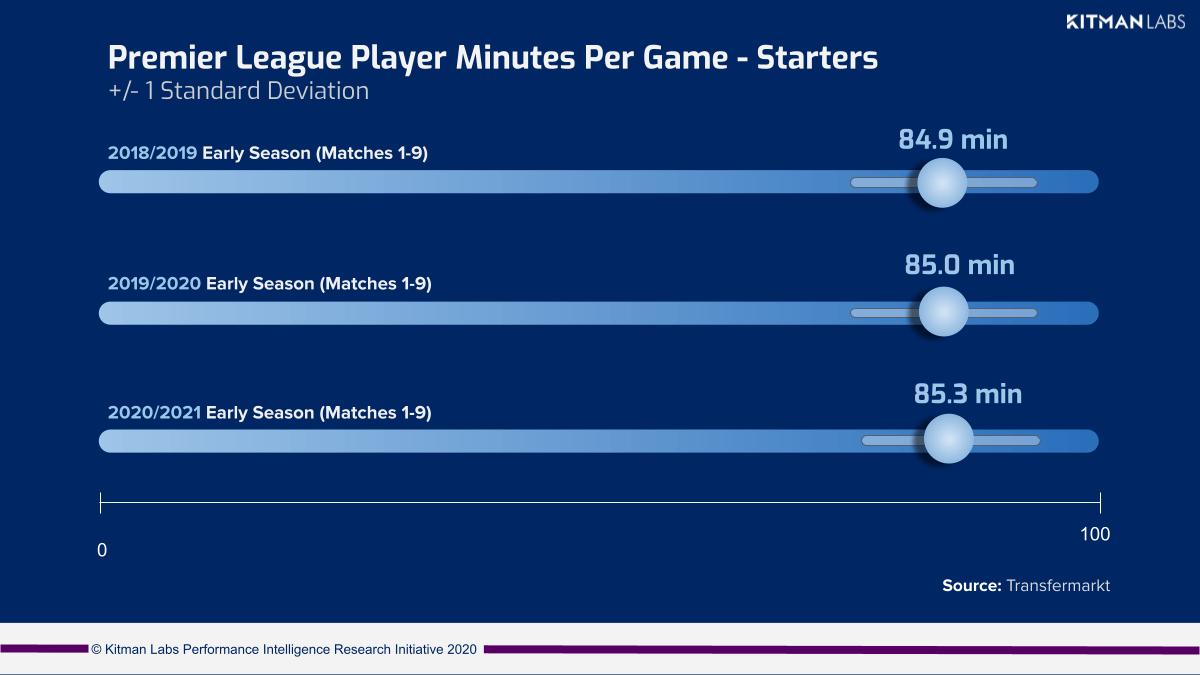
What is happening, then?
The issue at hand likely doesn’t stem from the amount of playing time players are exposed to in any single game, but more likely the increasing number and proximity of games that players are continuously exposed to, typically referred to as fixture congestion.
Fixture congestion has become the norm during COVID-19 across global sport and English football teams have had more than their fair share. In pre-COVID football, only the clubs playing multiple competitions had to navigate the perils of congestion. Now all teams are in the same boat. It doesn’t take a rocket scientist or sport scientist to understand that given the level of intensity in professional football today, rapid turnarounds create an enormous physical burden on players, made worse by limited recovery which research shows can increase injury risk from two to six fold.
This season, playing two games in a row with very short turnarounds is small potatoes. Our analysis uncovered chains of congested games that consist of 4, 5, or even 6 games in a row all played with three or fewer days between them. These congestion chains may very well be the trademark of COVID-19 in professional sports and could be one of the key factors behind the increased numbers of injuries we have seen this year.
Here’s an example of a seven game congestion chain (8 games in 22 days) experienced by Tottenham Hotspur this season:
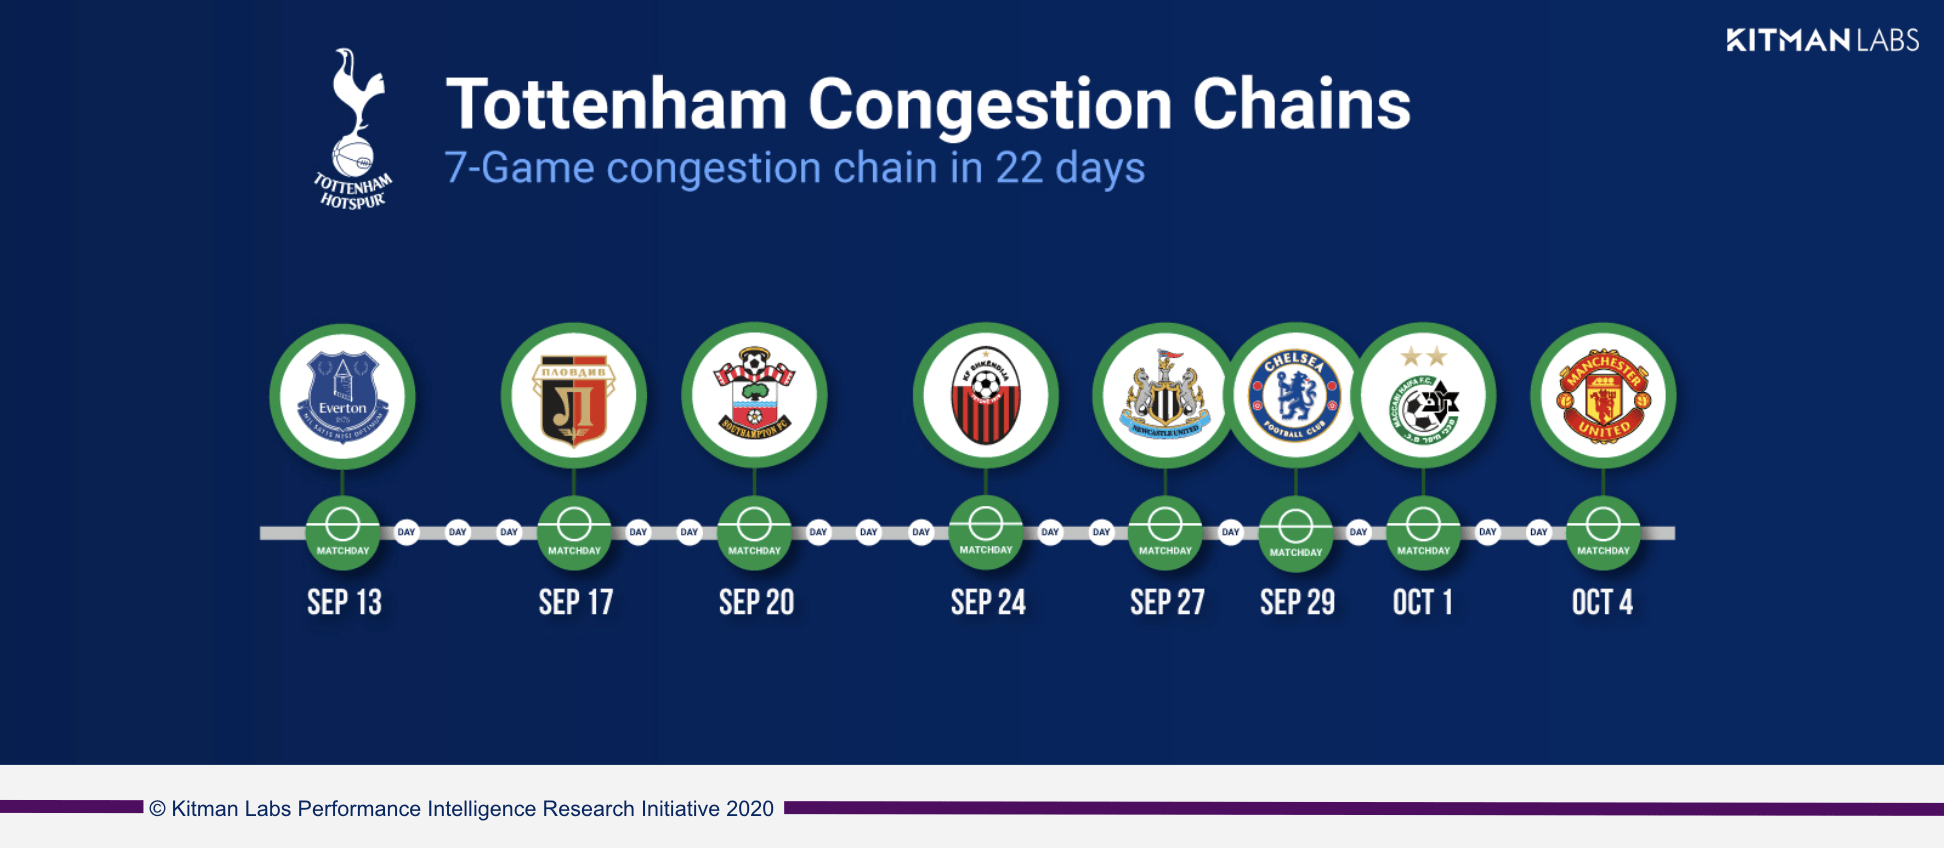
Not surprisingly, there are sizable disparities by team. Liverpool doesn’t have it as bad as Spurs, who played only three out of their first sixteen games outside of a congestion chain. Man Utd, Chelsea and Man City similarly endured higher numbers of early games bunched together. By contrast, Wolves, Sheffield, Southampton and Crystal Palace played only two of their first ten games in congestion chains.
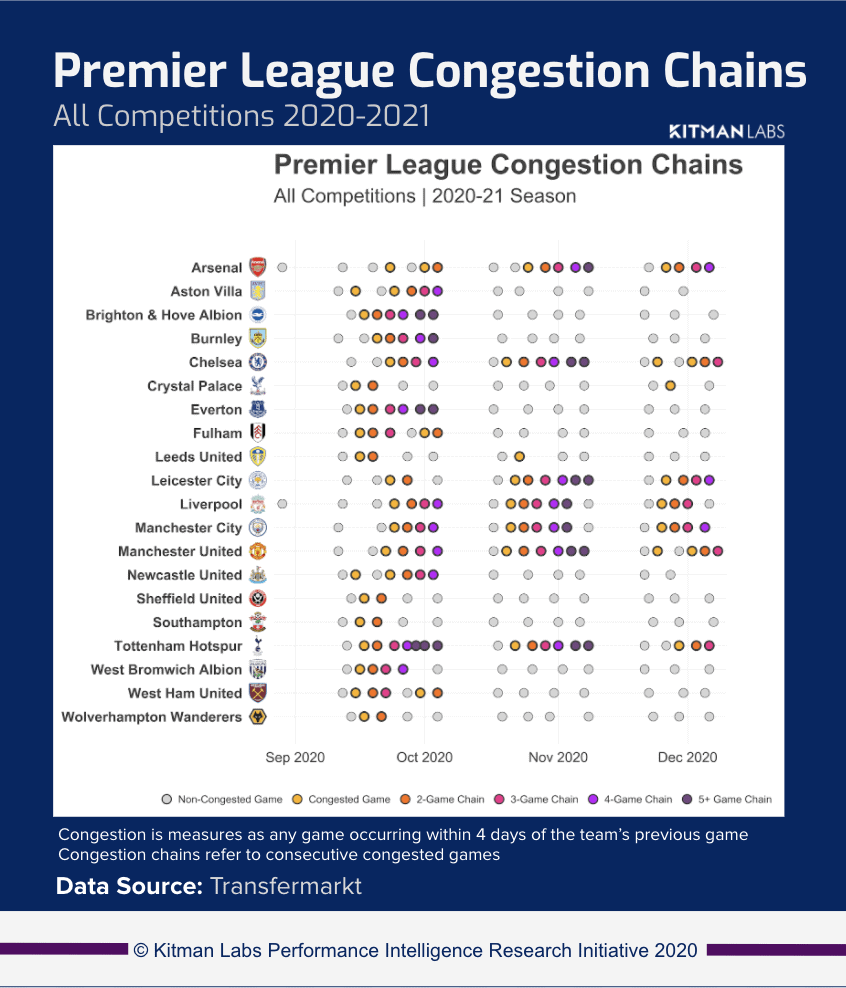
The teams suffering most from congestion chains are those competing on multiple fronts. For obvious financial reasons, participating in numerous competitions is lucrative and won’t be going away anytime soon. The teams with multiple national players have yet another layer of complexity with international travel and involvement in national tournaments. It will be no surprise that the teams that are competing across the most tournaments are the ones with the largest number of national players, further compounding their problems. It will be also no surprise that it is even further compounded for the player themselves (the above chart is for Premier League team games only, not international play).
For example, below is the volume of play required of Marcus Rashford when you add his English National duties to his Manchester United schedule. Across 28 days, Rashford played 9 total games consisting of two back to back chains broken only by a 27-minute game on his sixth game.
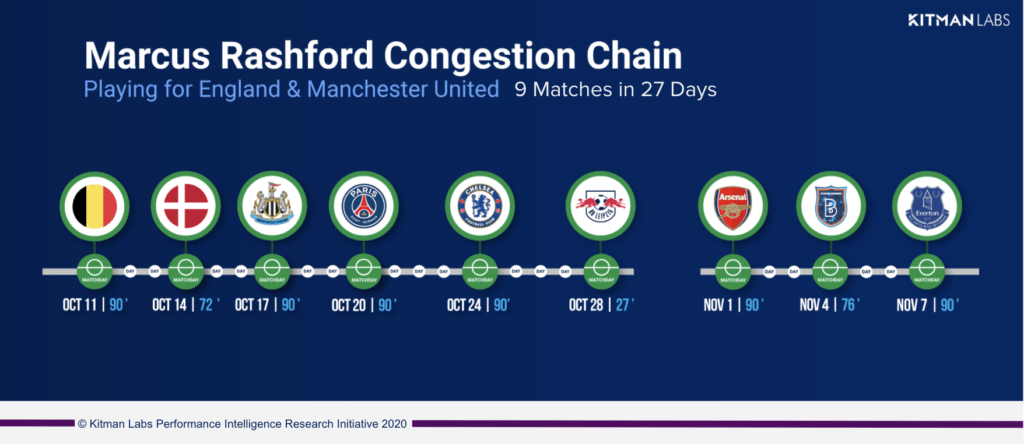
How bad is congestion for the typical Premier League player?
Looking at 2020 matches, we found that players are being asked to play in congestion chains at a dramatically different rate than years past:
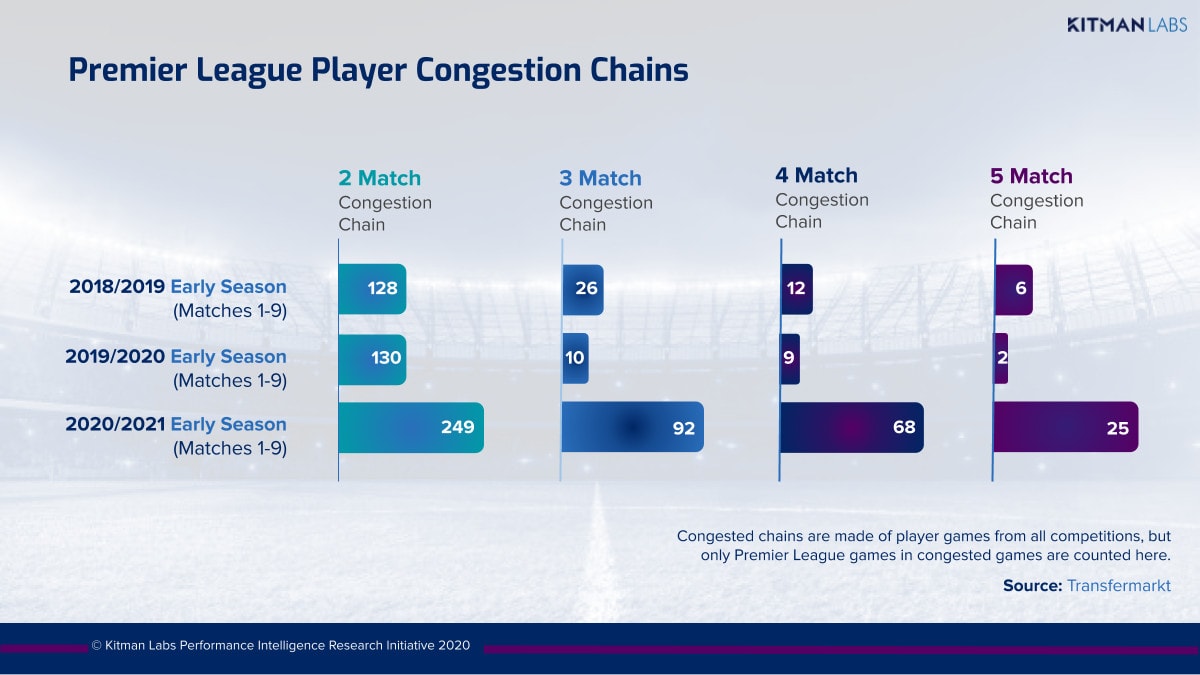
When comparing this season’s first nine matches against the same number of matches in the prior two seasons, footballers are playing in
- 2x the number of 2 match chains (3 matches in ≤9 days)
- More than 3x the number of 3 matches chains (4 matches in ≤13 days)
- More than 5x the number of 4 match chain (5 matches in ≤17 days)
- Nearly 5x the number of 5 match chains (6 matches in ≤21 days)
Breaking the Chains
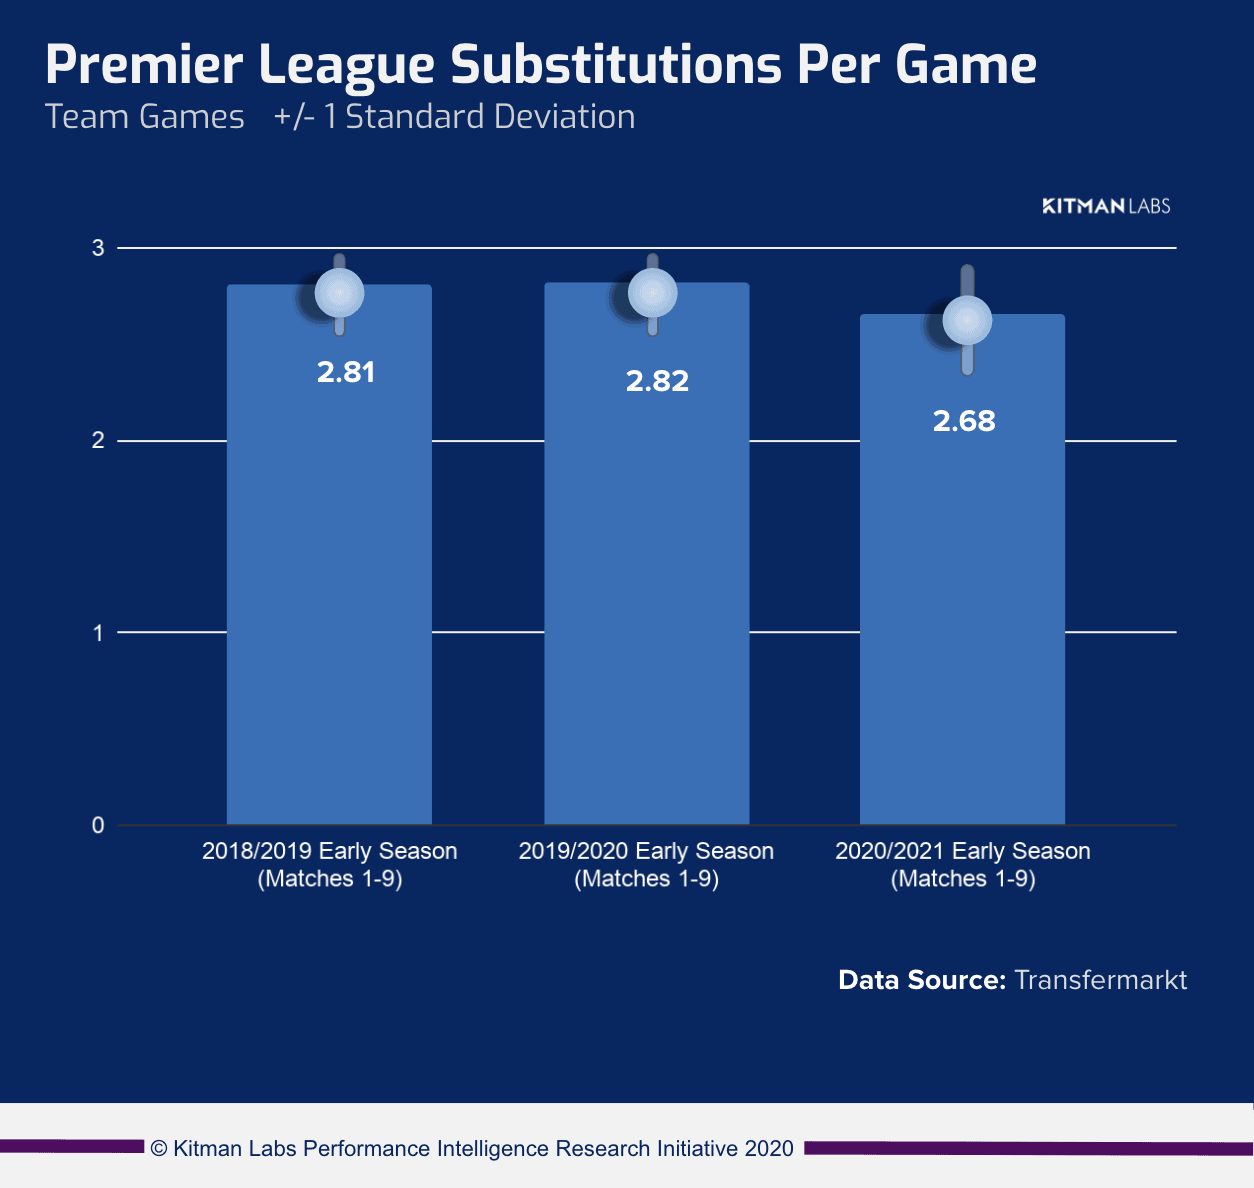
Would a league switch to five substitutions help to break the chains? Surprisingly, teams have used slightly fewer substitutions than in previous seasons at this point, with the average at 2.66 substitutions per game as opposed to 2.82 in 2019 and 2.81 in 2018. However, during the initial post COVID return to play when 5 substitutions were allowed, teams on average used 3.76 substitutes per game.
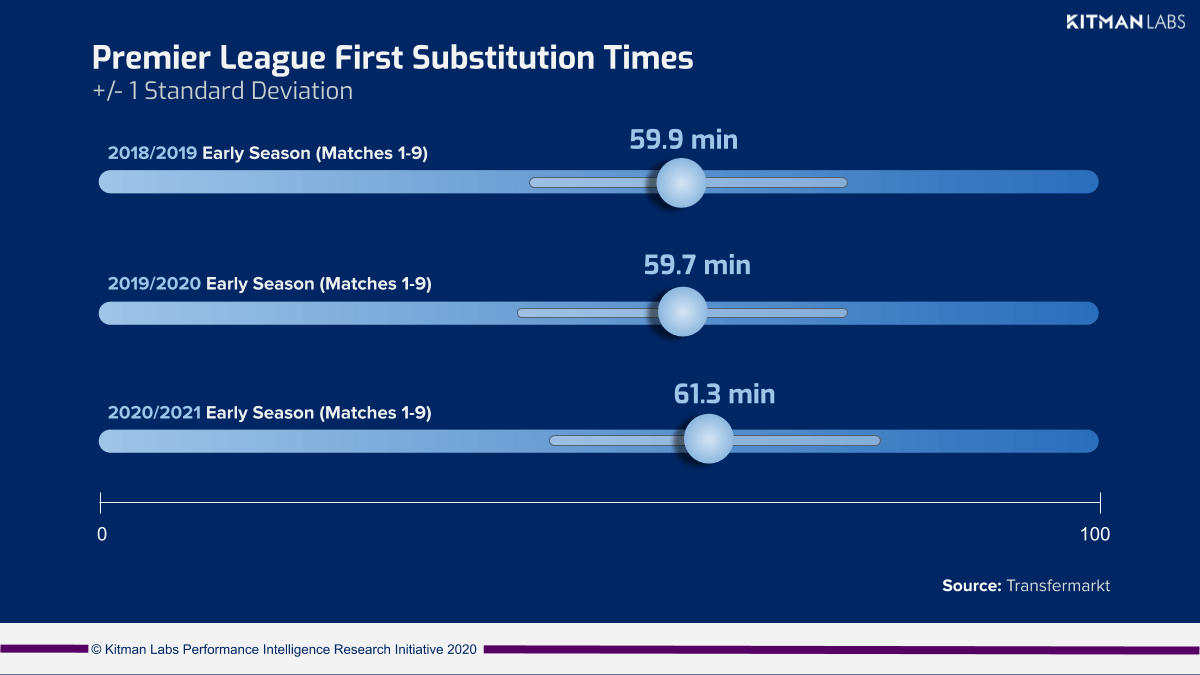
The timing of those substitutions hasn’t necessarily happened earlier in games to bring in fresh legs to replenish the potentially weary.
As you can see below, an additional two substitutes essentially had no meaningful impact on the average total number of minutes played across starters when 5 substitutions were permitted post COVID lockdown.
The more meaningful impact of substitutions lies in the ability to use them to break individual player congestion chains. Our five-substitution simulation reveals that substitution is not a cure in and of itself, but can have a significant effect, especially on longer more perilous congestion chains.
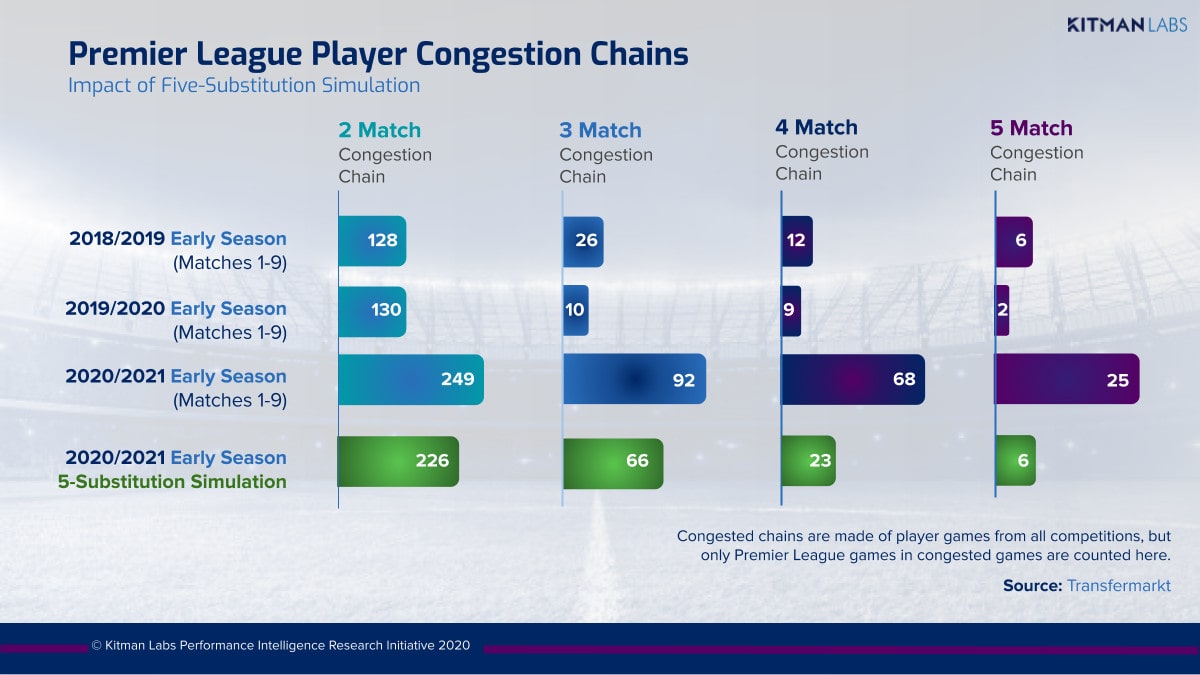
Our five-substitution simulation shows players could have experienced a:
- 9% reduction in 2 game chains
- 28% reduction in 3 game chains
- 66% reduction in 4 game chains
- 76% reduction in 5 game chains
While leagues may be able to help reduce some pressure by increasing substitution, clubs have agency, too. By thoughtfully leveraging data now, before Christmas drives them into survival mode (when injury rates in leagues without a winter break generally increase significantly), they can control the controllables and mitigate risks by adapting to the demands of their schedule.
Looking ahead at the remaining fixtures for December and January, it is easy to identify the congestion chains each team will encounter. This allows teams to adapt by working backwards to develop selection/rotation strategies to break these chains on an individual level.
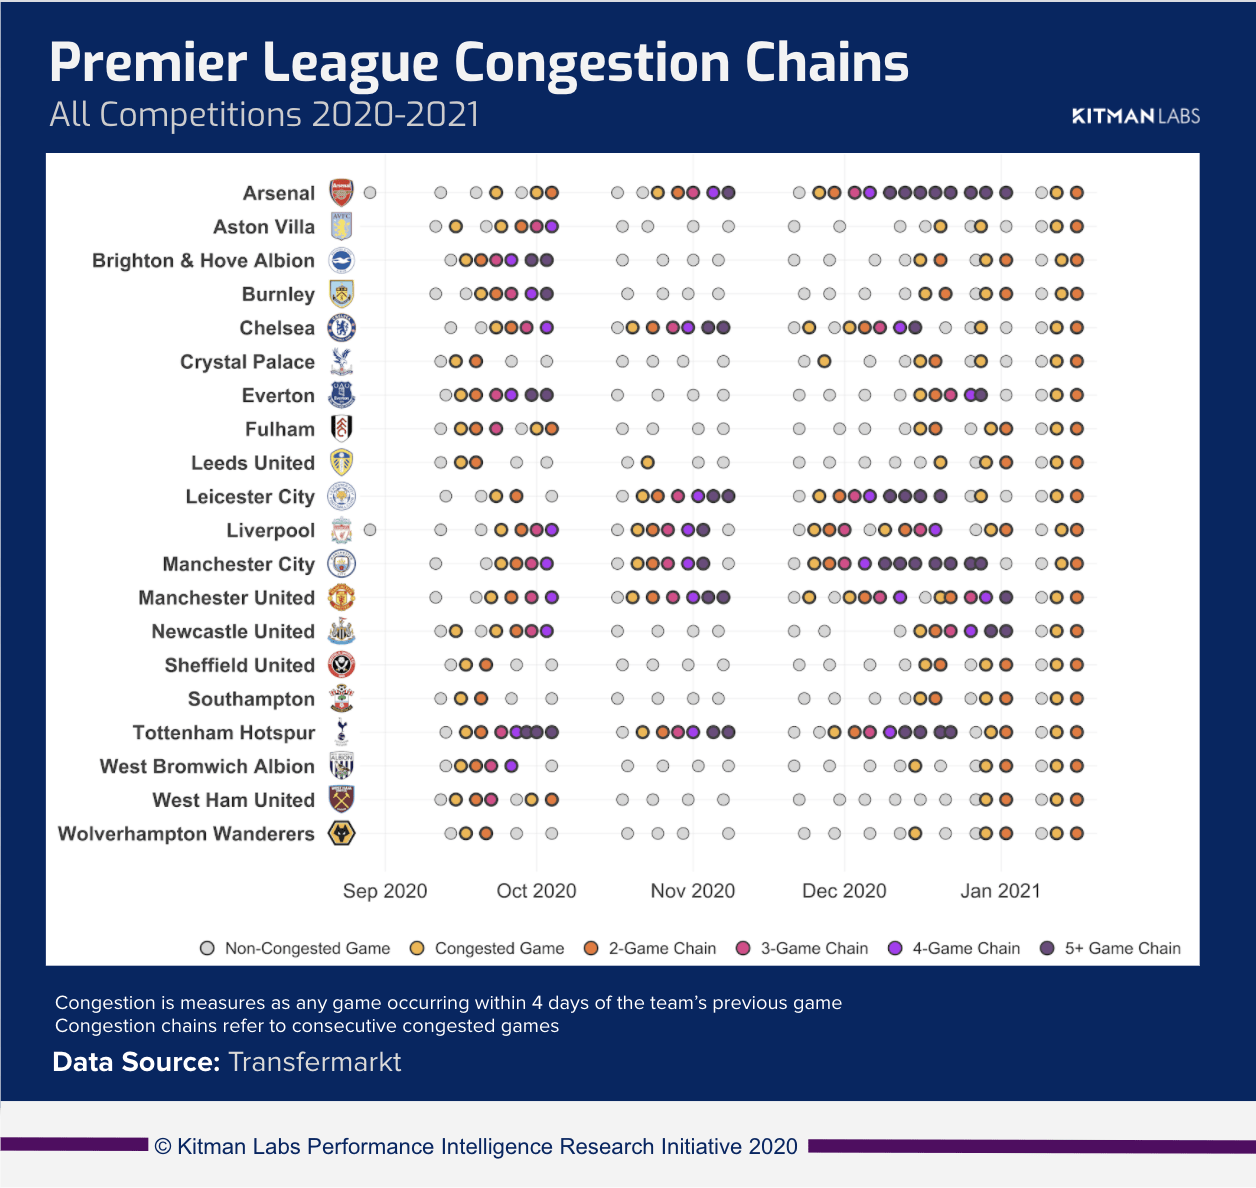
Coaching staff can identify the minutes expected of each player, adjusting as needed to better leverage the depth of their squads and rotate smaller parts of the playing group at different periods. The obvious challenge here is to plan this rotation whilst minimizing the impact on performance or disrupting the cohesion and synergy between the players.
Such maneuvers are available to organizations across all elite sports. For example, as the NFL struggles with higher injuries and disruption from Thanksgiving weekend (the beleaguered 49ers are perhaps the worst case scenario), a similar turn to evidence can help control the controllables. With so much disruption and teams needing every edge they can get, why not?
As I’ve written previously, now is the time for leagues and teams to harness previous investments in analytics to inform decisions in real time. No one foresaw COVID’s challenges, but the simple insights outlined above show the role that data can play in solving them. We’re working with teams on these issues now, to control the controllables and help everyone have a better Christmas than they otherwise would.
While the data and insights presented here are essentially descriptive, we believe that starting with a clear examination of the actual congestion patterns in the EPL (types of match chains and their occurrence) was a crucial first step toward a better understanding of the source of the problem. The Performance Intelligence Research team is currently working with Ben Dinnery and his team at Premier League Injuries on additional data related to injuries types and occurrences. We are confident that his collaboration will help us to quickly uncover new insights on the various impacts that congestion chains can have on injuries.
I welcome your feedback in the comments below, on my Twitter account or at stephen@kitmanlabs.com.
This research was provided by the Kitman Labs Performance Intelligence Research Initiative and authored by Ray Hamill, Derek McHugh, PhD, and Martin Buchheit, PhD
All data from Transfermrkt was sourced from: https://www.transfermarkt.co.uk/.
References
Are physical performance and injury risk in a professional soccer team in match-play affected over a prolonged period of fixture congestion?Carling C, Le Gall F, Dupont G.
Int J Sports Med. 2012 Jan;33(1):36-42. doi: 10.1055/s-0031-1283190. Epub 2011 Oct 19.
PMID: 22012641
The impact of short periods of match congestion on injury risk and patterns in an elite football club.
Carling C, McCall A, Le Gall F, Dupont G.
Br J Sports Med. 2016 Jun;50(12):764-8. doi: 10.1136/bjsports-2015-095501. Epub 2015 Dec 18.
PMID: 26682867
Match injuries in professional soccer: inter-seasonal variation and effects of competition type, match congestion and positional role.
Carling C, Orhant E, LeGall F.
Int J Sports Med. 2010 Apr;31(4):271-6. doi: 10.1055/s-0029-1243646. Epub 2010 Feb 17.
PMID: 20166007
The impact of in-season national team soccer play on injury and player availability in a professional club.
Carling C, McCall A, Le Gall F, Dupont G.
J Sports Sci. 2015;33(17):1751-7. doi: 10.1080/02640414.2015.1013051. Epub 2015 Mar 9.
PMID: 25751636
The effects of a congested fixture period on physical performance, technical activity and injury rate during matches in a professional soccer team.
Dellal A, Lago-Peñas C, Rey E, Chamari K, Orhant E.
Br J Sports Med. 2015 Mar;49(6):390-4. doi: 10.1136/bjsports-2012-091290. Epub 2013 Feb 19.
PMID: 23422422
Effect of 2 soccer matches in a week on physical performance and injury rate.
Dupont G, Nedelec M, McCall A, McCormack D, Berthoin S, Wisløff U.
Am J Sports Med. 2010 Sep;38(9):1752-8. doi: 10.1177/0363546510361236. Epub 2010 Apr 16.
PMID: 20400751
Injury Incidence and Workloads during congested Schedules in Football.
Howle K, Waterson A, Duffield R.
Int J Sports Med. 2020 Feb;41(2):75-81. doi: 10.1055/a-1028-7600. Epub 2019 Dec 2.
PMID: 31791088
Elite football teams that do not have a winter break lose on average 303 player-days more per season to injuries than those teams that do: a comparison among 35 professional European teams
Ekstrand, J, Spreco A, Davison,M.
Br J Sports Med. 2019 Oct;53(19):1231-1235. doi: 10.1136/bjsports-2018-099506. Epub 2018 Nov 15.
PMID: 30442720


